
OpenAI published an engineering account of its Performance Factory on November 19. The internal system uses Codex to investigate performance alerts, record findings and propose changes. An engineer reviews a proposed change and decides whether to merge it. After deployment, another agent checks whether the affected measure recovered. OpenAI says the first running workflow tracked more than 1,700 investigations and identified causes for more than 600 cases in just over three months. These counts describe the activity of a specific internal service. They give no measurement of how much faster ChatGPT became for a typical user during that time. OpenAI’s Performance Factory report
The engineering interest is in the handoff between stages. A performance alert can be genuine and still point to a symptom, or to a change in the mix of requests. A diagnosis can be plausible and still leave an important observation unexplained. A patch can improve one graph while making the program harder to maintain or changing its behavior. Splitting these questions makes it possible to hold an agent to evidence for each one. It also reveals where the bottleneck moves. Running more investigations is helpful only if the resulting information is specific enough for someone to decide what to change.
Start with the measurement that moved#
OpenAI describes a production setup that existed before it had the new workflow. Engineers examined traces, metrics, logs, profiles and code by hand, and accumulated more than 30 performance tools. One recurring issue was delay to the first generated token in ChatGPT. Access to those tools and knowledge of how to use them became part of the service’s shared investigation process. This matters when interpreting the reported throughput. The workflow does work on top of an observability system. A team with inconsistent metrics and scattered deployment history has different starting conditions. The agent can help it navigate what was captured, but missing timestamps or unreadable request boundaries are still missing evidence. OpenAI’s account of its earlier performance work
The service begins with an alert, then asks when the actual change started. An alert timestamp can be minutes or hours after a metric first begins to deteriorate. If a deployment falls before the alert but after the first change, it may be a weaker explanation than the apparent sequence suggests. The correct comparison depends on when an affected request encountered the changed service, not merely when the release was recorded as started. A feature flag can reach a subset of customers first. A dependency can roll out on a different schedule. Collecting those timestamps helps convert a list of concurrent changes into a test of the relevant ones.
A slower aggregate can also come from a different mix of work. Suppose 900 requests normally take 100 milliseconds and 100 take 600 milliseconds. The mean is 150 milliseconds. If the next hour contains 700 of the first and 300 of the second, the mean rises to 250 milliseconds with neither request type becoming slower. The service may still have a user-visible problem, especially if more people now use a slow feature. The remedy could differ from a regression that made the same request slower. Similar examples apply to cached and uncached paths, small and large payloads, or a route with a different model. Google SRE monitoring guidance
To test the movement, teams can define the affected population before examining causes. That may require product surface, device, region, request type, cache state or some other feature of the traffic. A matched comparison is more informative when the measurement boundary is also known. Time to first output, total request time and server processing time can all differ for the same request. OpenTelemetry’s HTTP metric conventions provide one example of specifying where a duration begins and ends. An application-specific metric can use another boundary if the report says what it measures. The choice determines whether a chart reflects what a user experienced or a smaller internal step. OpenTelemetry HTTP metric definitions
Percentiles and averages can tell different stories even for a comparable group. A handful of requests might wait several seconds while most remain close to baseline. The median can then look stable while a high percentile moves sharply. If a service serves few requests in the slice, a change in the tail can also be noisy. A readable task report would record the request count, period and distribution measure alongside the graph. It could also note whether the same case is visible to an externally observed test or only in one internal service. That helps someone decide whether a change reflects user impact, an internal optimization opportunity or a statistic that needs more observations.
OpenAI’s system records this context in a task outside of any individual agent’s session. A service dispatches the work ready for its next step. The company describes using a service identity for Codex, which gives it a way to scope permissions and identify work done by the agent. When a task needs to wait for a review comment or a deployment, it can subscribe to an event and become ready again. This is useful for performance investigations because the story may span a rollout, an edit and a later measurement. The durable information is the metric, the population and the evidence that explains the transition. Another worker should be able to see those without recreating an entire chat. Task workflow and service identity
A review should try to disprove the cause#
When an investigator finds a plausible service change, a separate review can ask what the hypothesis predicts. If a feature flag is responsible, requests that received the flag should show different behavior from otherwise similar requests that did not. If the flag was disabled for some customers, the affected measure should respond under comparable conditions. An unchanged comparison group does not automatically prove a cause, because traffic, dependencies and time can differ. It makes the test more useful than putting two event markers next to one another. This resembles familiar canary analysis. The quality of the comparison is as important as the model that performs it. Google SRE on canary releases
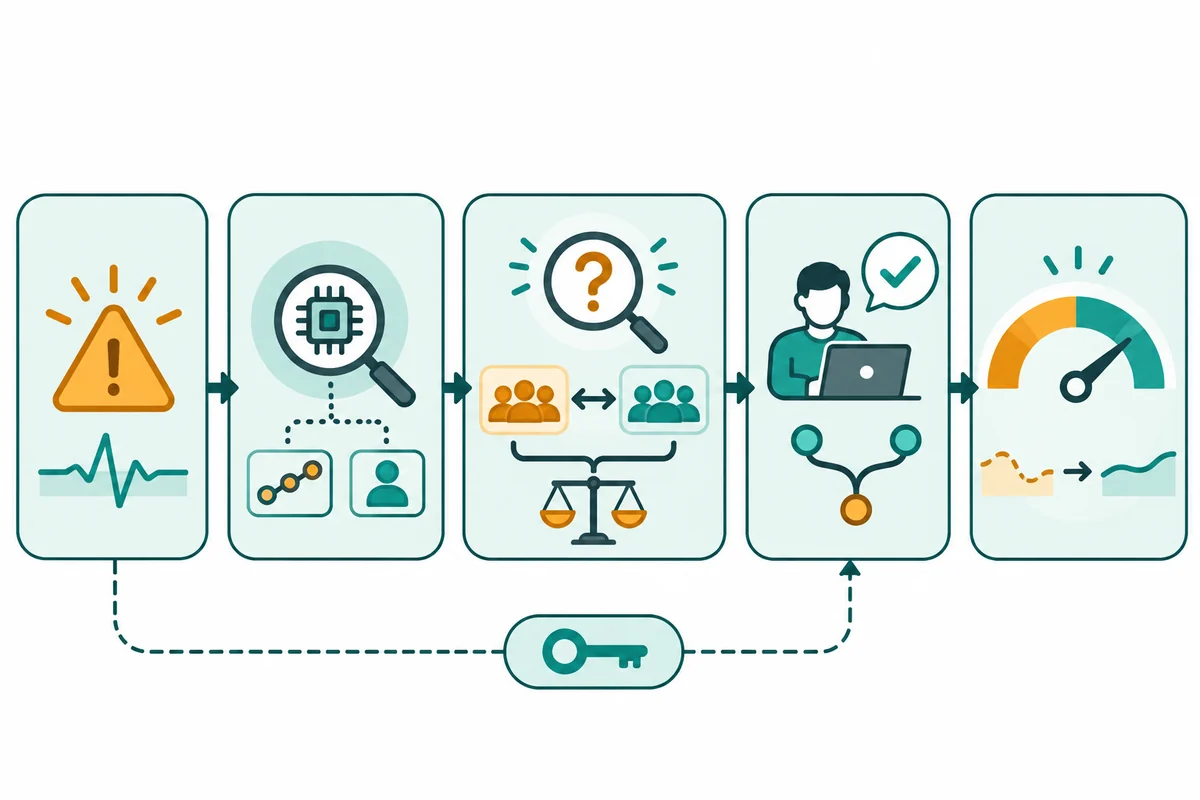
OpenAI’s example concerns image downloads in ChatGPT. An investigator attributed failing conversations to errors reaching an image. A separate review found that a service used to locate files had already recovered, while the image requests still failed. The suggested explanation covered part of the timeline and left the later interval unexplained. The task went back for investigation. This case describes what it means to use a second agent for more than editing a report. It needs access to the measurements, an instruction to check a specific claim and permission to say that the problem is still open. Changing the tone of a summary would not address the missing causal step. OpenAI’s example of diagnosis review
An explanation can fail in ways that should be recorded separately. It might identify when the issue began while blaming the wrong deployment. It might locate the affected path without explaining the size of the effect. It might explain a slower median while missing a large problem in the tail. A workflow can score these elements individually and carry forward the parts the investigator established. That helps the next person choose a question to answer. It also improves future evaluation. A score for the whole incident could reward a plausible story even when the result missed what changed for the people experiencing the problem.
An independent review is a division of work as much as a claim about judgment. When the same tools, instructions and model sit behind both agents, they may share blind spots. A reviewer can be made more useful by assigning a different objective, such as finding an unaffected cohort or checking what the code did at the relevant revision. It can also ask for a piece of evidence that would change its decision. An engineer can then see why the reviewer accepted the explanation and where uncertainty remains. That is a stronger basis for review than expecting two similar-looking conclusions to establish independence on their own.
The cost of a wrong diagnosis is also uneven. A bad explanation for a small transient alert may waste some review time. A proposal that changes a shared dependency can cause work for several teams and make a future incident harder to diagnose. The workflow need not demand the same depth of evidence for every observation. It can pair a focused check with the expected impact and record whether a proposed decision is reversible. A decision to gather more information can be a useful outcome in its own right. Preserving that disposition prevents a dashboard from equating every job without a patch with a failure to do anything.
The company says that in a manual review of 100 cause suggestions, 70 percent were graded accurate. The other 30 percent needed more work or had not fully established causality. This is a sample result on proposed diagnoses. It is separate from the more than 600 cases with an identified cause, and neither number describes the number of safe, deployed fixes. The study population and incident mix matter when comparing with another team. A usefully narrow reading is that the reported results left enough unresolved questions to make skeptical review part of the process. Publishing the selection method, review criteria and baseline would help another reader interpret what the proportion measures. OpenAI’s manual review results
A proposed fix has another quality bar#
OpenAI says it found proposing a good fix harder than finding a cause. Some changes were more complicated than necessary or introduced new problems. A cache can shorten a hot path and produce stale information if the underlying data changes, which the report gives as an example of an architectural trade-off. A targeted patch can be checked against a hypothesis. A wider rearrangement can make the outcome difficult to attribute and make recovery harder. Before reviewing the code, an engineer needs to know which behavior changes, what evidence supports the choice and what might go wrong when workload or data changes. That obligation is where design and operations meet. OpenAI on reviewing fixes
The review interface should preserve the evidence that changes a decision. A chart of the affected group before and after the change is often more helpful than a long transcription of agent activity. A trace can locate work in a service and a CPU profile can show which code used the time. They answer different questions. The summary can identify the source, time window and relevant comparison, with a link for those who need to inspect the original. If evidence is missing, the reader should see the missing step and the next plausible check. This design saves an engineer from reconstructing a large investigation before deciding whether the proposed change is warranted.
The changes that are easiest to verify have an expected effect on a particular measure and a way to see unintended effects. A synthetic performance test can reproduce the behavior on controlled inputs. A staged deployment can then show whether the result survives real request variation. For a delay to first output, a faster service span matters if the user’s time also improves. The test may need to watch error rate and time across the rest of the answer, because one metric can improve at the expense of another. An operation that uses less CPU but increases memory might move the constraint elsewhere. A review asks what balanced outcome would justify shipping.
OpenAI’s report describes the engine waking after an engineer deploys the fix. Recovery is checked against the earlier baseline. A fully recovered case can close. When improvement is only partial, the system can close the original regression and open a new task for the remaining slowdown. With no improvement, it returns to investigation. These paths acknowledge that one alert can contain several causes. The useful practical detail is what baseline and population were used after deploy. If the whole service is quieter at the time of verification, an improving graph can coexist with a remaining per-request defect. The affected requests and comparison should travel with the task. Post-deployment verification described by OpenAI
There are two separate clocks in a repair. One measures when code changed in the repository. The other measures when the new behavior was active for the affected traffic. Reading only the merge time can make a test window start too early. Reading only a total traffic chart can overlook users or regions that have yet to receive the change. An engineer can record the release identifier and the interval when it reached the intended group. That lets a later operator compare expected and actual behavior. It also gives a rollback or follow-up investigation a starting point if the apparent recovery does not persist.
An agreed comparison is particularly important when two remedies land near one another. The first may reduce total load, allowing an unrelated slow request to recover temporarily. The second may change the work done per request. Release order and a controlled measurement can help separate their effects. If full isolation is impractical, the task can state that multiple changes coincide and record which explanation remains uncertain. That is more informative than assigning a single recovery to whichever patch is newest. The next team can still act on a likely improvement while understanding which additional measurement would be needed to claim that a cause was removed.
Evaluate what the agent could have known#
The report describes replaying past incidents to test updates to the investigation process. The evaluator starts a fresh session with an original alert and omits the write-up and conclusions. It faces a problem that any historical evaluation has. Old logs and traces can expire, while data collected after an incident may reveal clues that were unavailable at the decision point. The report says OpenAI limits accessible production telemetry and reviews transcripts for material that might give away the answer. To evaluate work realistically, the test needs to capture the information available at the time and separately label what later became known. OpenAI on historical investigation tests
The incident outcome is a helpful comparator with limits of its own. A historical team may have mitigated the symptom without establishing the complete cause. The model may find a better explanation or make a superficially similar guess. Scoring the time, population and hypotheses separately gives the reviewer a way to handle these cases. It also shows whether a new workflow improves some categories and harms others. Repeated tests should record which evidence was preserved, model and instructions used and restrictions on access. When a system integrates a new step, testing only older incidents it was developed on might overstate the change’s value. Representative new cases are another check.
OpenAI also tests summaries separately on snapshots of existing tasks. A reader can judge whether a new engineer can identify the failure, its importance and what to do next, without running the investigation again. This offers a less fragile evaluation because it can use a saved task and stable evidence links. It still tests a real cost. Service owners must decide what to read and what to ship. Groups of related alerts and impact rankings can help them find one problem that appears in several places. Counting the work completed by agents without counting engineer review time leaves out the place where the system meets delivery. OpenAI on handoff evaluation and alert grouping
An evaluation can also include the failures of the tool chain. A permission change might remove access to a profiler. A dashboard query may stop returning a series. An agent can then write a convincing report that quietly omits the missing check. OpenAI describes looking for recurring access and tool errors in recent runs and creating work to fix them. A team can measure the frequency, effect and time to recover from missing evidence. Just as it instruments the service’s latency, it can observe whether its own investigation can still carry out each check. Improvements to a diagnostic workflow should be backed by evidence that the missing step actually works again.
The result to measure is a decision and a recovery#
Teams considering a similar workflow can select a narrow alert with known owners, reliable traces and a controlled change path. A useful pilot measures time from alert to usable explanation, time to an approved change, the number of proposals rejected or edited, and verified recovery on the same measurement. It can also show what happened with incidents the workflow failed to resolve, and how many summaries one engineer truly had to read. Comparing those measures to the existing process would say more than copying the raw volume from a company with different tools and traffic. The scale of the pilot can stay small while the evidence remains specific.
That comparison can include a workload measure for the humans. Consider a team that doubles its investigations and also doubles the number of suggested changes that require a person to reject them. It may see issues sooner and still take longer to ship a correct fix. A measure of investigations completed is useful beside median time to decision, corrections made by reviewers and cases where an engineer worked from the diagnosis but discarded the proposed patch. These outcomes have different values. Recognizing them can show whether the automation is best used to start an investigation, prepare evidence for review or draft code under particular conditions.
It is important to retain the difference between the published process and proposed future work. OpenAI says it is exploring whether some low-risk changes might eventually be shipped without human approval. The current sequence described in the report has an engineer review and decide what ships. Proactive detection without a fired alert is also work in progress. These changes would affect what should be measured. Automated release would need an evidence standard, an authorized scope and reliable recovery. Proactive detection would need a way to tell newly found issues from extra noise. Until those outcomes are published, the reported value is in finding and investigating regressions and helping engineers follow them through.
The Performance Factory’s most transferable idea is to give each step a question that can be answered with evidence. Did the same kind of request become slower? Does the proposed cause explain the full interval? What can the change safely alter? Did the treated traffic recover after release? That structure helps people and agents work on the same case without mistaking one step for another. The next progress worth measuring will be how often a team can make a decision sooner and verify recovery, while retaining a clear record of cases that still need work.